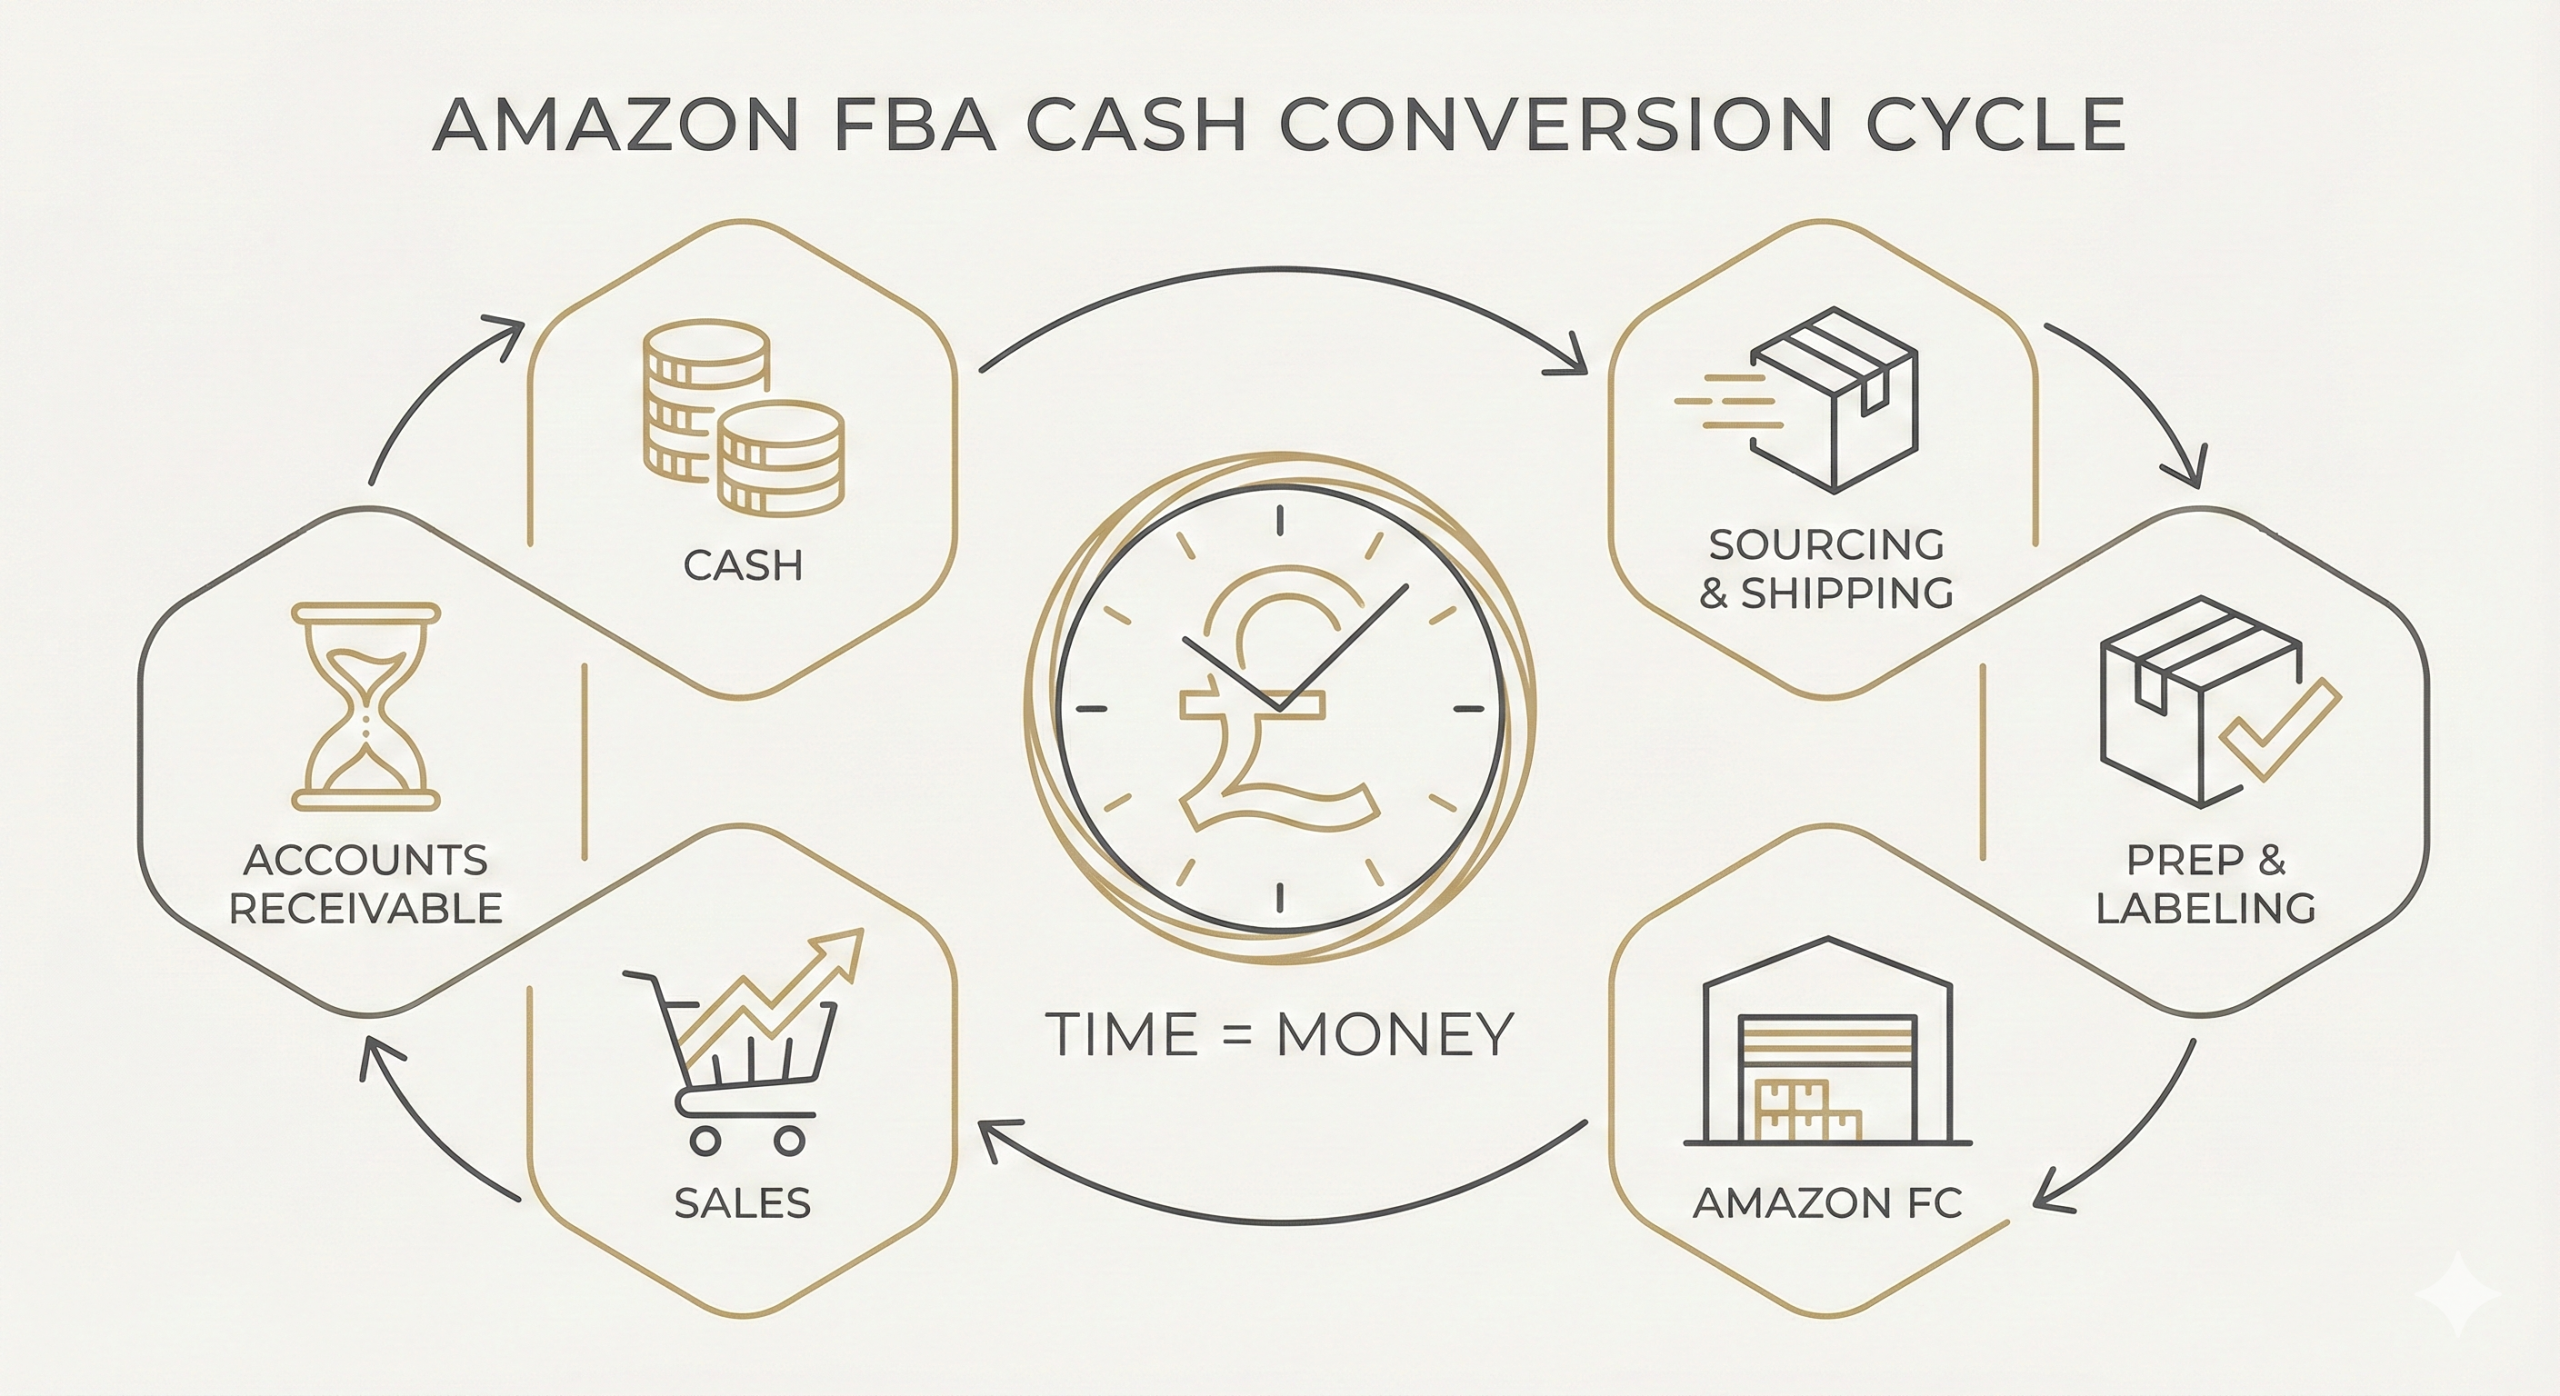
The Money Cycle for Amazon FBA
How small prep delays quietly destroy your compounding. In this example, you start with £200k in inventory capital, sell about £400k per cycle, keep 10% ROI on capital (around 5% net on sales), and see how a few days of extra prep time add up to hundreds of thousands over several years.
TL;DR
We focus on how fast your cash returns, not on a detailed P&L. In this model, you start with £200k of inventory capital. Each money cycle sells about £400k and returns 10% on capital (around 5% net on sales). The length of one cycle includes: other steps (supplier, inbound, basic handling), FBA prep, sell-through (25–30 days, default 27.5), plus Amazon’s 14-day disbursement delay. Faster prep shortens the full cash cycle, which means more cycles per year and more chances to reinvest the same capital. A six-day difference in prep time can mean roughly £575k more capital after 4 years in our example.
What the "Money Cycle" Means in FBA
Your inventory only earns money when it sells. The money cycle is the full journey from cash out (buying stock) to cash back in (Amazon pays you). Total lead time includes supplier production, inbound transport to the UK, FBA prep in a local warehouse, delivery to the Amazon fulfilment centre (FC), the time it takes to sell (sell-through), and finally the Amazon disbursement delay before you can reuse the cash.
Supplier Lead Time
Manufacturing and shipping from your supplier to the UK.
Inbound to UK Warehouse
Transport, customs clearance, and delivery to your prep centre.
FBA Prep Time
Receiving, labelling, packaging – the part you can control by choosing the right prep partner.
Dispatch to Amazon fulfilment centre (FC)
Shipping cartons or pallets from the prep warehouse to the Amazon FC.
Amazon Check-in & Sell-through
Amazon check-in, inventory becoming active, and the days it takes to sell through.
Key Insight
Every extra day your stock sits still stretches your money cycle. Fewer days in inventory mean more stock turns per year, faster cash conversion, and more chances to reinvest the same capital.
This logic matches findings from working capital research: shorter cash-conversion cycles often correlate with higher profitability.
The Simple Math Behind Compounding Speed
To keep the idea clear, we track only how your capital grows. We do not model every cost line on a full income statement. The question is simple: how fast does £1 of inventory capital leave, come back, and grow?
In the base case, sell-through is set to 27.5 days, with a sensitivity range from 25 to 30 days. The chart below shows how total lead time, including sell-through and disbursement, affects how many cycles you can run each year.
Interactive Case Study: See How Days Turn into Capital
Use the controls below to match your own situation. You can change starting capital, sales per cycle, ROI on capital, and each part of the timeline. The model compounds profit from each cycle into the next one and calculates how many cycles you can run per year based on the total number of days (other steps + prep + sell-through + disbursement).
| Input | Value | Notes |
|---|---|---|
| Starting capital (£) | Capital deployed per cycle | |
| Sales per cycle (£) | Sales generated by that capital per cycle | |
| ROI per cycle on capital (%) | Profit per cycle = ROI × capital | |
| Other steps (days) | Supplier + inbound + check-in | |
| Sell-through (days to sell) | Default 25–30 days | |
| Amazon disbursement (days) | Cash delay to reuse capital | |
| Prep A (days) | Typically 24h | |
| Prep B (days) | Slower baseline | |
| Implied net margin on sales | ≈ 5.00% | Calculated as (ROI × capital) ÷ sales |
Results
| Metric | Prep A (1 d) | Prep B (7 d) |
|---|---|---|
| Total Cycle (days) | 54.5 | 60.5 |
| Cycles/Year | 6.70 | 6.03 |
| Annual Capital Multiplier | 1.893× | 1.777× |
| Capital after 1 Year | £378,658 | £355,430 |
| Capital after 4 Years | £2,569,794 | £1,994,931 |
In the default example, Prep A completes in 1 day and Prep B in 7 days. This six-day gap looks small on a calendar. Over four years, it becomes a difference of about £575k in capital. Nothing else changed: same products, same ROI per cycle, same starting £200k. Only prep speed.
A vs B
A vs B
A vs B
Sell-through time is the other big lever. Even if prep is fast, slow sell-through stretches the money cycle. The sensitivity table shows how the number of cycles per year and the annual capital multiplier change when you move from 25 to 30 days to sell.
Sensitivity: Days to Sell
| Sell-through | Prep A (1 d) | Prep B (7 d) |
|---|---|---|
| 25 d — Cycles/Year | 7.02 | 6.29 |
| 25 d — Annual Multiplier | 1.952× | 1.822× |
| 27.5 d — Cycles/Year | 6.70 | 6.03 |
| 27.5 d — Annual Multiplier | 1.893× | 1.777× |
| 30 d — Cycles/Year | 6.40 | 5.79 |
| 30 d — Annual Multiplier | 1.841× | 1.737× |
What Fast Prep Center UK Controls
You cannot control Amazon’s internal processes, but you can control what happens before your stock reaches the fulfilment centre (FC). We designed our FBA prep centre UK service around predictable speed, so you can plan stock turns instead of guessing them. We complete receiving and Amazon-compliant prep within 24–72h depending on volume, with 24h service for standard shipments received before our daily cut-off.
For a full breakdown of unit fees and operations, you can check our FBA prep pricing UK page and compare scenarios by product type and volume.
Typical receiving and prep time once goods arrive at our warehouse.
Labelling, packaging, and paperwork aligned with Amazon FBA requirements.
Shared spreadsheet with receiving confirmation data, prep status, and unit counts.
Predictable SLAs You Can Plan Around
When prep times are stable and visible, you can build your stock plans on them. Reliable speed turns into reliable cash conversion. That is how prep time becomes a clear profit driver, not just a small operational detail.
How to Use This Framework
Model Your Turns
Map each step from purchase order to Amazon payout. Add the days and divide 365 by the total to see how many cycles you can run per year.
Lock the Controllables
Fix a clear prep SLA with your warehouse and align supplier deliveries so that stock does not wait on the floor.
Reorder by Calendar, Not Panic
Place purchase orders so that new stock lands in time for immediate prep and dispatch, based on your money cycle, not on last-minute stock-outs.
Protect Throughput First
Compare prep options on total impact, not only on fee per unit. A cheaper fee that costs you part of a money cycle is usually more expensive in the long run.
Track Outcomes
Monitor days in inventory, Amazon check-in delays, and cycles per SKU. Adjust your targets as you see real numbers over several months.
Plain English Takeaway
The Compounding Effect in One Line
Faster, predictable prep today means you sell sooner, restock sooner, and reuse your capital more often. Repeat this cycle and your profits do not just add up – they compound. That is why choosing a fast, Amazon-compliant UK prep warehouse is not a small operational choice; it is a long-term profit decision.
Frequently Asked Questions
Not always, but very often. If faster prep gives you more full inventory turns per year without adding errors, it usually creates more profit than a small discount per unit. Saving £50 in fees but losing part of a money cycle is usually a bad trade.
You cannot control how fast Amazon scans your cartons and activates your inventory. You can control receiving, prep, paperwork, and dispatch. The goal is to remove self-inflicted delays so that the total money cycle is as short and predictable as possible.
The exact numbers in the calculator are hypothetical, but the logic is based on real research on working capital. Multiple peer-reviewed studies show that shorter cash-conversion cycles are linked to higher profitability across different types of companies.
Ready to Accelerate Your Money Cycle?
See how Fast Prep Center UK can help you turn prep speed and clarity into more inventory turns and stronger capital growth over time.
References (Open Access)
Lazaridis, I., & Tryfonidis, D. (2006). Relationship between working capital management and profitability. Journal of Financial Management and Analysis. Full text on SSRN →
García-Teruel, P. J., & Martínez-Solano, P. (2007). Effects of working capital management on SME profitability. International Journal of Managerial Finance. Post-print PDF →
